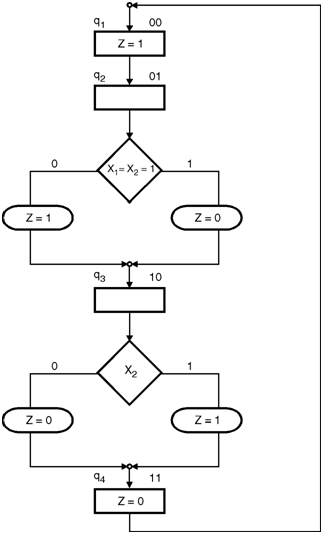
The ASM chart can be drawn by defining four states q1, q2, q3 and q4 as shown in Figure. Each state corresponds to a time period of one clock pulse. The output Z in any state is dependent conditionally on the inputs X1 and X2.
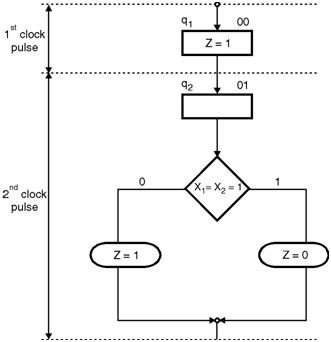
ASM block for first clock cycle :

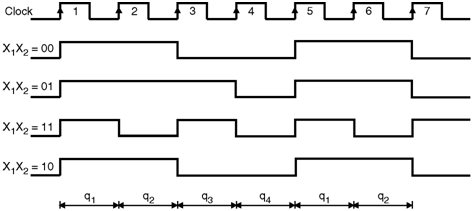
In the state q1 corresponding to the first clock pulse, all the waveforms are high. Hence the output of the waveform generator (Z) should be 1 irrespective of the value of X1 and X2.The ASM block for the first clock cycle is shown in Figure.
ASM block for second clock cycle : In the second clock pulse state q2 will come in picture. In this state the output Z =1 For all the other combination of inputs except for X1 X2 = 11. The chart upto this state is shown in Figure.
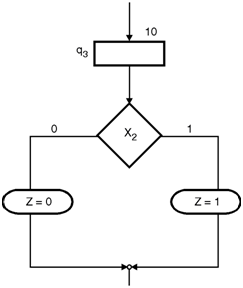
ASM chart for third clock pulse : In the third clock pulse the corresponding state is q3. The generator output Z =1 if X2 = 1. The chart upto this state is shown in Figure.
State q4 is corresponds to the fourth clock pulse. Output Z of the waveform generator is '0' irrespective of the inputs X1 and X2. In the next clock cycle the operation starts repeating itself. The complete ASM chart is shown in Figure below.