Home > mini projects > Heart Beat sensor using Photoplethysmography
Heart Beat Sensor using Photoplethysmography
Abstract - Heart rate is a very vital health parameter that is directly related to the soundness of the human cardiovascular system. This project describes a technique of measuring the heart rate using principle of photoplethysmography.
Photoplethysmography (PPG) is a simple and low-cost optical technique that can be used to detect blood volume changes in the microvascular bed of tissue. It is often used non-invasively to make measurements at the skin surface.This project utilizes an IR led and sensor to detect the fluctuations at the fingertip due to the pumping of blood. Hence these fluctuations can be further amplified and can be processed to measure heartbeat.
This project provides simulation results of the designed circuit on ngspice which include transient, transfer function and noise analysis of the circuit which is used to evaluate the performance of the simple low cost circuit.
I. INTRODUCTION
T HE Heart rate measurement indicates the soundness of the human cardiovascular system. This project demonstrates a technique to measure the heart rate by sensing the variation of the blood volume inside a finger artery, which is caused by the pumping action of the heart. It consists of an infrared LED that transmits an IR signal through the fingertip of the subject. A part of this infrared light is reflected by the blood cells. The reflected signal is detected by a photo diode sensor. The changing blood volume with heartbeat results in a train of pulses at the output of the photo diode, the magnitude of which is too small to be detected directly. Therefore, a two-stage, high gain, active low pass filter is designed using two Operational Amplifiers to filter and amplify the signal to appropriate voltage level so that the pulses can be counted.
The heart rate is displayed on a LED display.
Ngspice is acircuit simulation program for nonlinear and linear analyses of analog and digital circuits.
II. MOTIVATION
The motivation behind designing this simple heart pulse circuit was a project "Heart Rate Display LED T-shirt" at Cornell University. There they built a LED t-shirt capable of displaying the heart rate of the wearer via a pulsing LED heart. Hence this was the driving force because of which we came up with a simple cost effective heat beat sensing circuit
that can be used to visualize heartbeat using led, and also it can be used for simple analysis of heart beat pulse at institute or school level.
III. DESIGN AND WORKING OF THE CIRCUIT
A. Theory
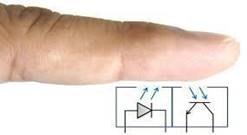
Here we describes a simple analog circuit that uses optical sensors to measure the alteration in blood volume at fingertip with each heart beat. The sensor unit consists of an infrared light-emitting-diode (IR LED) and a photodiode, placed side by side as shown below. The IR diode transmits an infrared light into the fingertip (placed over the sensor unit), and the photodiode senses the portion of the light that is reflected back. The intensity of reflected light depends upon the blood volume inside the fingertip. So, each heart beat slightly alters the amount of reflected infrared light that can be detected by the photodiode. With a proper signal conditioning, this little change in the amplitude of the reflected light can be converted into a pulse.
B. Circuit Description
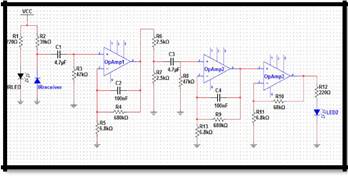
The signal conditioning circuit uses technique called photoplethysmography. There is an IR LED whose light is reflected by the skin and received by an IR sensor. The changes in volume of blood over the time changes the amount of reflection which is detected by the IR sensor and it is this signal which now filtered and amplified to get the pulse in desired range. Actually, there are two types of unwanted voltage signals in the signal received from input the constant DC voltage and the noise from surroundings. Thus the reflected IR signal detected by the photo diode is fed to the signal conditioning circuit that filters the unwanted signals and boost the desired pulse signal. For removing the DC voltage, there is (passive) high pass RC filter with 0.7Hz as cut off frequency. To remove the noise, there is (active) low pass op-amp filter with 2.3Hz (This means the maximum measurable heart rate is about 150 bpm.) as cut off frequency and gain of nearly 100. So till now the net effect is a band pass filter that
allows 0.7Hz to 2.3Hz and amplifies the signal by 100. But this provides neither sufficient filtering nor sufficient amplification. To further filter and amplify the signal, the signal from first module is fed to an exact duplicate module containing passive high pass filter and active low pass filter. After this, amplification is nearly 10,000 and signal has frequency component only between 0.7Hz and 2.3Hz.The gain of each filter stage is set to 101, giving the total amplification of about 10000. The signal is further fed to an op-amp with gain of 10.An LED connected at the output blinks every time a heart beat is detected.
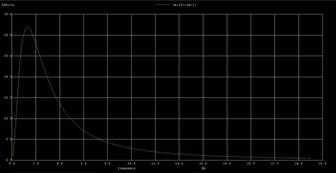
Further we analyzed the frequency response which is show below. The cutoff frequency from the simulation was found to approximately 2.5kHz . Also the noise at input terminal and output terminal was found to be 7.29e-15 and 9.25e-7 respectively which is very small and hence the circuit is immune to noise and distortion and thus a good filter for measuring the heartbeat pulses.
IV. NGSPICE
Ngspice is a general-purpose circuit simulation program for nonlinear and linear analyses. Ngspice has built-in models for resistors, capacitors, inductors, mutual inductors, independent or dependent voltage and current sources, loss-less and lossy transmission lines, switches, uniform distributed RC lines, and the five most common semiconductor devices: diodes, BJTs, JFETs, MESFETs, and MOSFETs., and the user need to specify only the pertinent model parameter values and thus one can use this software to model the actual circuit and evaluate the performance of the circuit and carry out analysis of the circuitry.
We have used ngspice for the transient analysis, ac and noise analysis of the signal conditioning circuit.
V. RESULTS
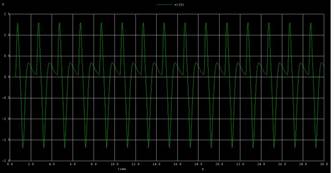
The results of simulation of the designed circuit is shown below. It displays the heartbeat pulse for 30 sec. We obtained this result by modeling the pulse at fingertip as an approximate triangular wave close to a real human beat.
VI. CONCLUSION
This project focuses on the heart beat measuring sensor based optical method called photoplethysmography. The circuit purposed here is very simple, easily implementable and practical too as well as cost effective and hence can be used as
a heart beat sensor over other conventional ones for simple analysis at educational level.